Free Trial Edition – Use 100% Of The Software For Free For 14 Days
After your 14 days are over, all of your data will remain and can be viewed however you will not be able to Add/Edit Runs or utilize the Predict or Tune Up options.

After your 14 days are over, all of your data will remain and can be viewed however you will not be able to Add/Edit Runs or utilize the Predict or Tune Up options.
As an existing RaceAir Cloud customer, for a limited time you will get a free upgrade to the the RaceBase Predict Edition. The Predict edition is the top of the line option. Simply download the software and when registering type your RaceAir Cloud serial number into the Cloud S/N field and hit Register. You will get a response in 5 business days after we confirm your purchase.
[action full_width=”yes” content_in_grid=”yes” type=”simple” text_font_weight=”” show_button=”no” background_color=”#999999″]
[/action]
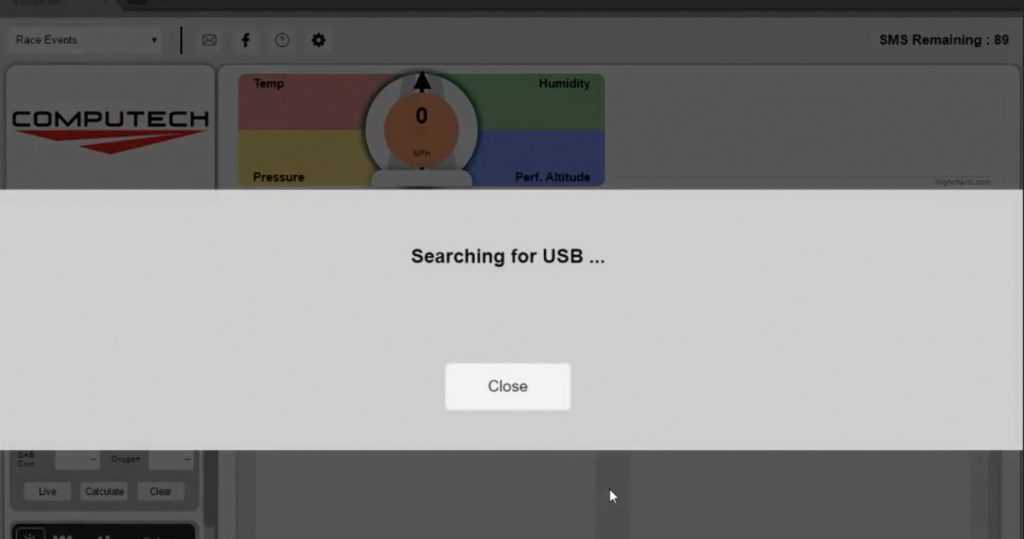
Installing the RaceBase Weather Software is extremely easy and only takes a couple steps. You can also watch the RaceBase Weather Installation Video to watch an installation.


Temperature (degrees Fahrenheit) is also referred to as dry bulb temperature. In order to correctly calculate the effect of temperature on performance, the measured temperature needs to be similar to the engine intake air temperature.
Relative humidity is a value to indicate how much water vapor is present in an air sample. Air has the ability to hold more water vapor as the temperature increases. This phenomenon makes comprehending water vapor content difficult. By always relating the amount of water vapor present to the maximum amount that air could hold at that temperature, the relationship is easier to understand (i.e. 50% RH is always 50% of the possible saturated water vapor content for air at any temperature).
Absolute barometric pressure, measured in inches of mercury (Inches Hg), is the pressure that is present at the location of the sensor from the atmosphere. The term ‘barometric’ comes from the weather instrument, the mercury barometer, which is used as a laboratory precision measuring device. The term ‘absolute’ refers to absolute zero, where without the earth’s atmosphere, the measured pressure would be 0 Inches Hg. Normal pressure gages have a scale that sets the atmospheric pressure of 14.7 pounds per square inch (29.92 Inches Hg) as the zero point. This is referred to as gage pressure. The RaceAir provides the absolute barometric pressure that is used in the calculations for ADR, Density Altitude, and the Correction Factor. It has the biggest influence on air quality. Absolute barometric pressure normally varies between 25 and 31 Inches Hg depending on the elevation above sea level where the sensor is. The atmospheric pressure defined as Standard Day at sea level is 29.92 Inches Hg and decreases about 1 Inch Hg per 1000 ft. of elevation.
Wind Speed & Direction are fairly easy to understand as long as you understand a circle is 360 degrees. Zero degrees or North would actually be a tail wind while 180 degrees or South would be a head wind.
True Tail Wind: 315 to 45 degrees
Side Wind: 45 to 135 degrees or 225 to 315 degrees
True Head Wind: 135 to 225 degrees
The sunlight meter is actually measure in Lux, the derived unit of illuminance. This sensor is used to measure the intensity of the suns light, as perceived by the human eye. This number is actual times 1,000 so a Sunlight reading of 45 is actually 45,000 lux. This value will change anywhere from 0 to 100 depending on the intensity of the sunlight.
Performance Altitude is similar to Density Altitude in that it is measured in terms of feet traveled in the air or elevation. The primary difference between Density Altitude is that the Performance Altitude number is a more accurate formula for how engines create horsepower. Performance Altitude is essentially the Standard Correction Factor value represented in terms of feet instead of an arbitrary value that is harder for the human mind to relate to. This value should be used over Density Altitude whenever applicable.
The correction factor is a Society of Automotive Engineers (SAE) equation that uses the calculated dry barometric pressure and the measured local temperature to compensate for changes in dynamometer observed horsepower readings due to air density differences. This method allows performance comparison of observed readings taken on different days or in different parts of the world. The correction factor can also be applied to track performance. There are 2 correction factor equations in common use in the industry – the current SAE and STD or the old SAE standard. The STD and SAE methods also have different reference points (where correction factor 1.000 occurs). Therefore, values corrected with one method cannot be compared to values corrected by the other.
Density altitude is a value in feet that relates the local measured atmospheric conditions (absolute barometric pressure or pressure altitude, temperature, and relative humidity) to the aeronautical industry defined standard day atmosphere. The density altitude for an absolute barometric pressure of 29.92 Inches Hg or a pressure altitude of 0 ft, a temperature of 60F, and a humidity of 0% is 0 ft. A good air day in the spring or fall might be below 0 ft (i.e. –831 ft). Conversely, a hot summer day might have a density altitude of 4500 ft. (equivalent to 4500 ft of altitude on a standard day).
Air density ratio (ADR) is the ratio produced by dividing the calculated density of the air being sampled by the Standard Day air density. Standard Day air is defined as a temperature of 60F, a relative humidity of 0%, and an absolute barometric pressure of 29.92 In. Hg. The ADR for those conditions is 1.00. The RaceAir Pro expresses this ratio as a percent, Standard Day = 100%, as an aid to understanding the performance increases and decreases that air density causes. Air Density Ratio is used to determine engine fuel tuning changes. If the ADR goes down 2%, then fuel must be reduced 2% to stay at the same air/fuel ratio.
Water Vapor or Humidity Grains (grains, Gr) is the same information as ‘Vapor Pressure’ expressed in different units. Some race teams use 100 Gr as the threshold for making water vapor related tuning changes. Engine fuel flow and ignition timing may need to be increased above the threshold.
The dew point temperature is the calculated temperature at which the measured partial saturation of water vapor in the air will turn to liquid and form dew. Moisture can cause inconsistent traction and, in certain circumstances, effect engine performance. The warmer the air is the more water vapor it can hold. See ‘Relative Humidity’ for more information. An air sample has a specific amount of water vapor present. As the temperature drops and reaches the dew point, the air can no longer hold the water vapor suspended so it condenses and turns to water. This condensation will occur on cooler surfaces first. Computech research with methanol fuel, and to a lesser extent with gasoline, has shown that when the ambient temperature falls to within 5 to 10F of the dew point temperature there will be an unexpected slight fall off in performance due primarily to fuel degradation in the intake manifold that is caused by water contamination. By keeping accurate records as to when the performance actually falls off in relation the outside temperature versus the dew point temperature, performance degradation can be predicted.
Vapor pressure (Inches Hg) is a value calculated from the sensed temperature and relative humidity. The RaceAir Pro uses numbers derived from mechanical engineering steam tables to calculate the partial saturation vapor pressure of the moisture in the sampled air. That value is displayed and used in the ‘Dry Barometric Pressure’ computation. The vapor pressure number indicates the portion of air pressure that is actually from water vapor and, of course, will not support combustion.
Wet bulb temperature refers to using an expanding liquid type thermometer with a water soaked cotton wick over the sensing bulb. This technique produces a lower temperature indication for lower humidity conditions due to evaporation. The wet bulb temperature and the dry bulb temperature can be used to calculate ‘Relative Humidity’.
Pressure altitude is the aircraft altimeter indicated value in feet that results from setting the pressure adjustment window to 29.92 Inches Hg. This number relates to the aeronautical industry defined Standard Day altitude. An indication of 0 ft is equal to an absolute barometric pressure of 29.92 Inches Hg. Lower or negative values (i.e. –180 ft) indicate more air pressure. Higher values (i.e. 2500 ft) show less air pressure. An altimeter will also show absolute barometric pressure (Inches Hg) in the pressure window when the altitude pointer is rotated to indicate 0 ft. Note that this number is pressure only. Until it is adjusted for temperature and humidity via the density altitude process it is not an indication of total air quality.
The dry barometric pressure (Inches Hg) is the absolute barometric pressure with the partial saturation water vapor pressure from humidity subtracted. The measured absolute barometric pressure is from a combination of oxygen, nitrogen, argon, and some other trace gases plus water vapor. The portion of the air that is water vapor will not contribute to combustion of the fuel and therefore must be factored out. Dry barometric pressure is used to calculate ADR, Density Altitude, and the Correction Factor.
You can reach Matt via our Evening & Weekend Tech Support Line by phone at 301-884-5718.
When utilizing the RaceBase Weather Text Message feature you will receive text messages directly to your phone. For this reason we recommend saving the phone number the messages come from as RaceBase and utilize the free picture below.
To set the image as your contact, simply click and hold on the image below and select Save. Then edit your RaceBase contact to include the picture.
![]()
[action full_width=”yes” content_in_grid=”no” type=”normal” text_font_weight=”” show_button=”yes” button_target=”_blank” background_color=”#dd3333″ button_text=”CONTACT US” button_link=”/contact” button_text_color=”#7d7d7d” button_hover_text_color=”#515151″ button_hover_background_color=”#dddddd” button_hover_border_color=”#dddddd”]Can’t find the right answer? Call our 24/7 Tech Line at 301-884-5718.[/action]