Description
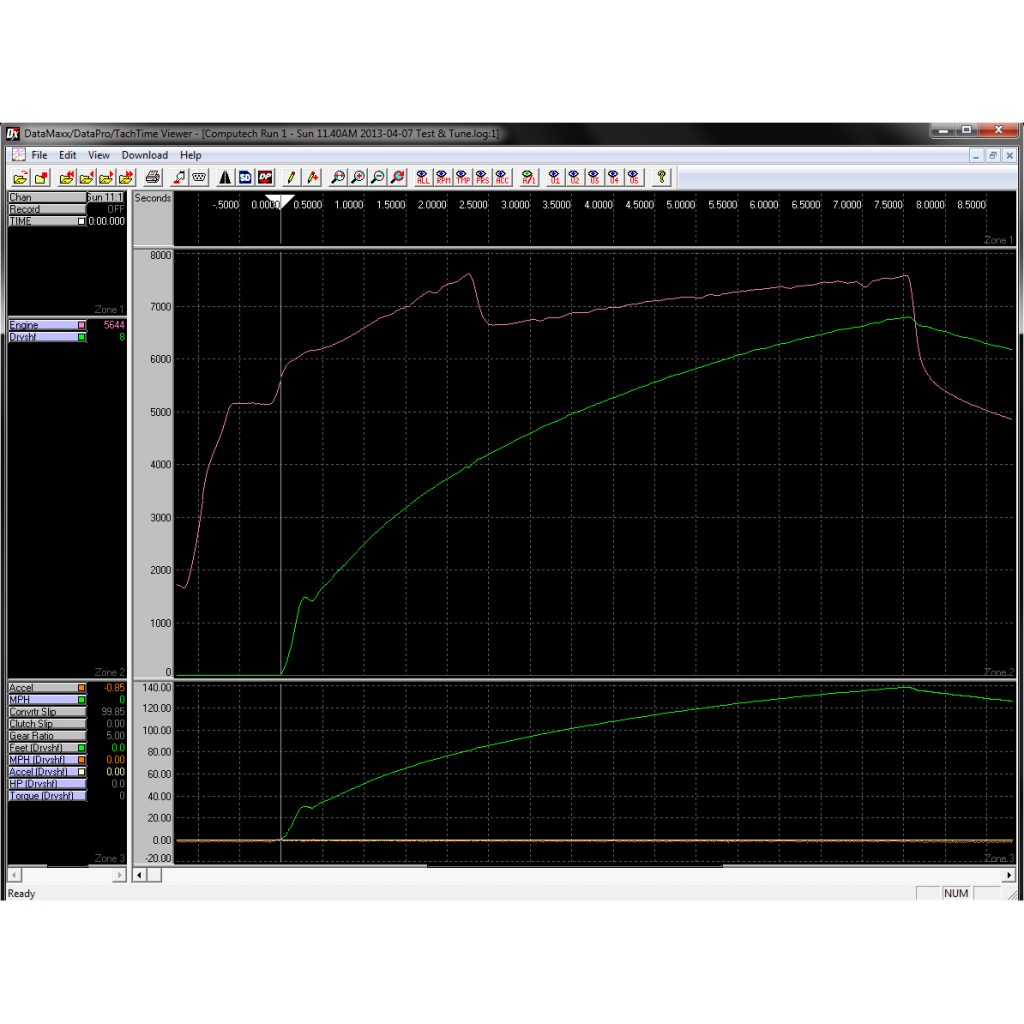
The DataMaxx software allows you to visually graph all of your DataMaxx log files. The DataMaxx Viewer Software makes it as easy as possible to download all of your log files and keep them organized by year and event with quick notes for easy run identification. We offer multiple pre-defined views that seperate your information into logical chunks. Views are All Channels, RPM, Temperatures, Pressures, Accessories and All-In-One. Our graph highlighting feature allows you to easily identify a specific sensor or channel and our smoothing filters ensure you can get the most out of your data.
Located below you will find an extensive collection of video tutorials to help guide you through the software.


